Hungry Hunter Multi-Party Monitoring
Quick links for files discussed in this document:
|

|
Area Analysis for Key Ecosystem Components
in Hunter Mountain Late-Successional Reserve
and Hungry Hunter Environmental Assessment
by
George Wooten, Conservation Northwest Associate, PO Box 501, Twisp, WA 98856
Date: February 23, 2004
To: Responsible Official,
James L. Boynton
Forest Supervisor Okanogan and Wenatchee National Forests
c/o District Ranger John E. Newcom
24 West Chewuch Road
Winthrop, WA 98856
Subject: Hungry Hunter Ecosystem Management Project
Dear Okanogan & Wenatchee Forest Planning Staff:
Enclosed are analysis documents
in support of comments submitted for the Hungry Hunter Ecosystem Management
Project. Our analyses determined likely treatment impacts from on the following
ecosystem components: old growth / mature forests, Late-Successional Reserves,
RARE II roadless areas, uninventoried roadless areas, unsuitable harvest
areas, distance to wildland-urban interface (WUI) zones, wetlands, unroaded
road density and forest connectivity.
Sincerely yours,

George Wooten
Conservation Northwest Associate
Background
There is a need to evaluate ecosystem management projects using a geographic information system (GIS). A GIS provides information on the spatial arrangement of management units under different environmental and managerial scenarios.
Kettle Range Conservation Group evaluated the Hungry-Hunter Ecosystem Management Project Environmental Assessment (EA), which is proposed within areas managed under the Northwest Forest Plan. In order to assess the area, we used Arcview GIS in combination with information from field visits.
Methods
Our analyses determined likely treatment impacts from on the following ecosystem components: old growth / mature forests, Late-Successional Reserves, RARE II roadless areas, uninventoried roadless areas, unsuitable harvest areas, distance to wildland-urban interface (WUI) zones, wetlands, unroaded road density and forest connectivity.
The treatment area boundaries were created by digitally scanning timber sale maps and converting these to feature (polygon) shape files. The maps were overlaid onto digital orthophotos. Additional layers added included streams, roads, vegetation cover types, digital raster graphics, vegetation seral stages, and USDA Forest Service online data.
Layers created for this analysis include the following:
- RARE II roadless areas
- uninventoried roadless areas
- late-successional reserve (LSR) areas designated in the Northwest Forest Plan
- late-seral and structured mature forest stands determined by photo-interpretation
- unsuitable harvest areas
- wetland areas buffered by 300 feet
- wildland-urban interface (WUI) buffer around private structures, divided into intervals of 0.5 miles
All of these layers were exported to an external DBASE4 database (x7.dbf) and linked to the stand ID field so that there was one record for each of the 151 polygons representing treatment units. The table was added into Arcview and joined to the treatment unit layer and used to create a new shape file containing all of the fields above. The shapefile containing this information linked with the unit boundaries is referred to here as Units-12.
The unit numbers for the treatment areas were retained in cases where the original unit boundaries did not change shape, but new unit numbers were assigned in the sequence from 901-920 for polygons which had to be split out to allow different treatment proposals to be selected.
Results
Our analyses determined likely treatment impacts from on the following ecosystem components: old growth / mature forests, Late-Successional Reserves, RARE II roadless areas, uninventoried roadless areas, unsuitable harvest areas, distance to wildland-urban interface (WUI) zones, wetlands, unroaded road density and forest connectivity. These are discussed individually below.
Mapping accuracy
Our maps were compared with the acreage figures in the EA on pp. 2-6 to 2-10 to determine the following levels of agreement between our mapping efforts and that of the Forest Service. These are shown in the following table.
| Treatment | KRCG (ac) | EA(ac) | Difference % |
| Alternative 2 BT | 1017.900 | 1017 | 0.1 |
| Alternative 2 LP | 30.246 | 28 | 8.0 |
| Alternative 2 HT | 1993.794 | 1964 | 1.5 |
| Alternative 2 ST | 179.601 | 175 | 2.6 |
| Alternative 2 TSI | 2281.28 | 2334 | -2.3 |
| Alternative 3 BT | 928.104 | 941 | -1.4 |
| Alternative 3 LP | 39.877 | 43 | -7.2 |
| Alternative 3 HT | 2067.714 | 2110 | -2.0 |
| Alternative 3 ST | 200.077 | 214 | -6.5 |
| Alternative 3 TSI | 1816.466 | 1775 | 2.3 |
| Alternative 4 BT | 696.449 | 683 | 2.0 |
| Alternative 4 LP | 0 | 0 | ---- |
| Alternative 4 HT | 1803.762 | 1785 | 1.1 |
| Alternative 4 ST | 0 | 0 | ---- |
| Alternative 4 TSI | 1386.414 | 1335 | 3.9 |
Table of difference between Kettle Range Forest Group and Methow Ranger District mapping of Hungry Hunter treatment units (BT = Biomass Thin; LP = Patch Lodgepole Regeneration Harvest; HT = Harvest Thinning; ST = Seed Tree Regeneration Harvest; TSI = Timber Stand Improvement).
Discussion
The two largest differences were -6.5 % and 8 %, neither of which represented more than about 4 acres, so the agreement between the two different maps of treatment boundaries indicates an acceptable comparative analysis can be made with these unit boundaries.
EA map discrepancies
One of the initial objectives accomplished by this analysis was to independently identify inaccuracies or unaccounted assumptions made in the EA. The EA maps did not use a consistent delineation of stands for each alternative, making it difficult for comparisons to be made between alternatives. More importantly, because stands are not the same size and shape for each alternative, the EA was inconsistent and sometimes in error in describing impacts for each alternative, which precludes confidence in any conclusions drawn. To avoid this pitfall in our analysis, all of the stands from each different alternative were intersected which resulted in splitting out 20 new polygons that could be consistently mapped for all EA treatment descriptions. From this new map of proposed harvest treatment areas, we were able to determine mapping inconsistencies in the EA.
The treatment areas which were inconsistently mapped or described in the EA included the following:
- unit 005 is a different shape in different alternatives
- unit 026, alternative 3 is not in the EA list of stands in appendix C-4
- unit 041, alternative 3, is not in the EA list of stands in appendix C-4
- unit 044 is a different shape in different alternatives
- unit 044 is part of unit 167 in different alternatives
- unit 057 listed as ST in the EA appendix C-4 is not included in the map of alternative 4
- unit 061 listed as ST in the EA appendix C-4 is not included in the map of alternative 4
- unit 066 is a different shape in different alternatives
- unit 068 listed as ST in the EA appendix C-4 is not included in the map of alternative 4
- unit 069 is a different shape in different alternatives
- unit 069 listed as ST in the EA appendix C-4 is not included in the map of alternative 4
- unit 069 overlaps unit 090 in different alternatives
- unit 072 is a different shape in different alternatives
- unit 072 overlaps unit 078 in different alternatives
- unit 072, alternative 3, is not in the EA list of stands in appendix C-4
- unit 077 is a different shape in different alternatives
- unit 078 overlaps unit 072 in different alternatives
- unit 082 is a different shape in different alternatives
- unit 082 overlaps unit 089 in different alternatives
- unit 089 is a different shape in different alternatives
- unit 089 overlaps unit 082 in different alternatives
- unit 089, alternative 3, is not in the EA list of stands in appendix C-4
- unit 090 overlaps unit 069 in different alternatives
- unit 091 listed as BT in the EA appendix C-4 is not included in the map of alternative 4
- unit 092 is a different shape in different alternatives
- unit 092 overlaps unit 093 in different alternatives
- unit 093 doesnt exist in some alternatives
- unit 093 is a different shape in different alternatives
- unit 093 is in two different places under different alternatives
- unit 093 overlaps unit 092 in different alternatives
- unit 095 is listed as Biomass thin in appendix C-4, but it is Harvest Thin on the alternative 3 map
- unit 099 is a different shape in different alternatives
- unit 100 listed as HT in the EA appendix C-4 is not included in the map of alternative 4
- unit 103 is a different shape in different alternatives
- unit 107 is a different shape in different alternatives
- unit 113 listed as HT in the EA appendix C-4 is not included in the map of alternative 4
- unit 114 is a different shape in different alternatives
- unit 117 is a different shape in different alternatives
- unit 121 listed as BT in the EA appendix C-4 is not included in the map of alternative 4
- unit 121 listed as BT in the EA appendix C-4 is not included in the map of alternative 4
- unit 130 listed as BT in the EA appendix C-4 is not included in the map of alternative 4
- unit 136 listed as BT in the EA appendix C-4 is not included in the map of alternative 4
- unit 149 is not shown as separate from unit 103 on the alternative 3 map
- unit 152 listed as BT in the EA appendix C-4 is not included in the map of alternative 4
- unit 153 listed as BT in the EA appendix C-4 is not included in the map of alternative 4
- unit 155 listed as BT in the EA appendix C-4 is not included in the map of alternative 4
- unit 156 listed as BT in the EA appendix C-4 is not included in the map of alternative 4
- unit 160 listed as BT in the EA appendix C-4 is not included in the map of alternative 4
- unit 161 listed as HT in the EA appendix C-4 is not included in the map of alternative 4
- unit 166 listed as BT in the EA appendix C-4 is not included in the map of alternative 4
- unit 167 is a different shape in different alternatives
- unit 167 overlaps unit 044 in different alternatives
Discussion
There are significant numbers of inconsistencies and errors in the EA. Because of this, the EA information on stand shapes, acreages, numbers and treatments should be corrected and used to run the analyses again. This will be necessary to establish accurate baseline data before monitoring can begin.
Determination of roaded areas
To determine roaded areas
in the analysis area, the roads layer of the Okanogan National Forest was
overlaid onto the orthophotos and digital raster graphics maps and adjusted
using photo-interpretation. This resulted in the following road layer which
is only slightly different from the one in the EA:
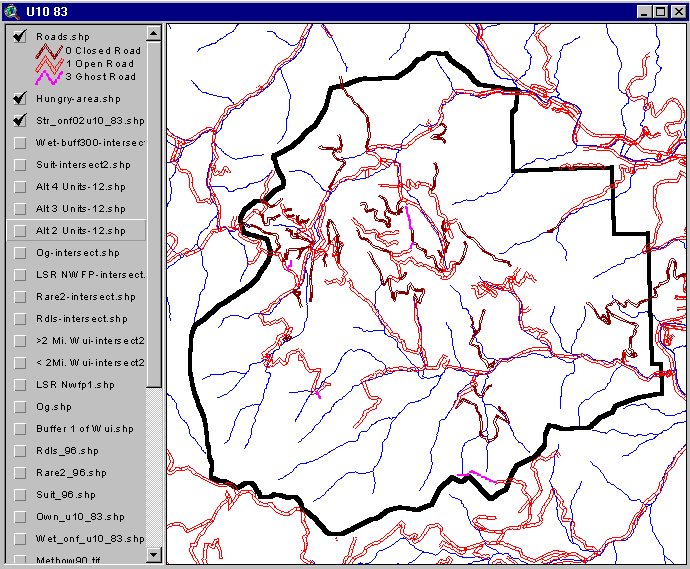
Discussion
Our road maps are fairly consistent with those in the EA, however a few errors have likely affected the road density calculations in the EA. There are ghost roads (roads which do not exist, in purple) evident where no road is apparent on the 1998 orthophotos. If so, these should be removed from the EA and Forest Service maps. There are also several miles of roads not included in the EA such as the one crossing the analysis boundary on the center right above, which were not included in the road mileage analysis. Overall there are about as many errors of commission as omission between the maps.
During field visits, the closed roads were found to be impacting the environment significantly in a number of different ways. Many closed roads had scattered patches of weeds, which are spreading in an uncontrolled fashion due to the fact that there is no effective way to inspect these roads. Almost all roads at lower elevations had extremely degraded, sandy ash-cap soils which made breathing difficult during cattle movements. Almost all closed roads had blocked culverts and eroding cut banks in some places. Many old roads were used as logging and skidding roads in the past, and received heavy abuse, which we recommend should be corrected.
In order to accomplish this, it would be necessary to for every one of the closed roads to be visited on the ground by specialists who would determine the need potential permanent obliteration and/or rehabilitation. Our field visits found areas that do not appear to have the attention of the Forest Service, which we recommend should be corrected.
The impact of closed roads will get worse as weeds spread without management, and as cattle continue to graze the area in an uncontrolled manner. Thus, the primary impacts from roads is on soils, weed and hydrology. In contrast, the EA used an analysis of open road density which does not adequately address impacts, nor lay a sound framework for future restoration. Because of this, the EA did not disclose enough information about impacts from treatment units. Treatment units with significant miles of closed roads should not be treated until this analysis is complete.
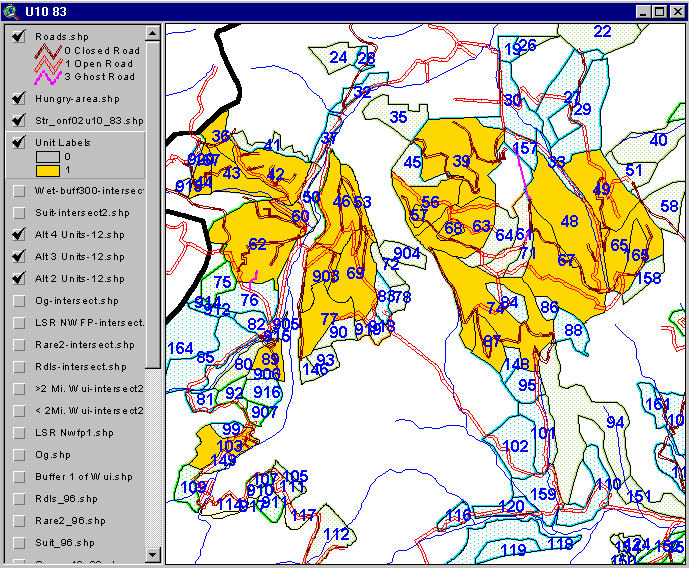
Higher road densities that
were omitted from the EA were scored with a 1 in the unit shapefile Units-12.shp
(see table at end of document). Units which will have greater impacts than
documented in the EA are 36, 39, 42, 43, 44, 46, 48, 49, 53, 56, 57, 60,
62, 63, 65, 67, 68, 69, 74, 77, 87, 89, 103, 165, 167, 903. These units
are illustrated below.
Determination of roadless areas
To determine where proposed treatments occur in roadless areas the unit boundaries were intersected with both inventoried and uninventoried roadless areas.
Units overlapping RARE II roadless areas (shown in red below) are: 105, 107, 111, 112, 114, 117, 126, 134, 910, 911, 917.
Units overlapping uninventoried roadless areas shown in purple below are: 2, 3, 4, 5, 6, 8, 9, 11, 12, 13, 15, 17, 19, 22, 24, 26, 27, 29, 30, 31, 34, 40, 41, 42, 49, 51, 58, 66, 70, 73, 75, 76, 77, 80, 81, 82, 85, 89, 90, 92, 93, 99, 102, 103, 105, 107, 109, 110, 111, 112, 114, 115, 116, 117, 118, 119, 120, 121, 124, 125, 126, 127, 128, 129, 130, 131, 134, 135, 136, 146, 150, 152, 153, 154, 155, 156, 159, 160, 162, 163, 164, 166, 901, 902, 903, 906, 907, 910, 911, 912, 914, 916, 917, 918, 919.
These areas and the overlapping
units are depicted below.

Discussion
Roadless areas have intact soil strata that should be protected from disturbance by ground-breaking machinery. The Northwest Forest Plan designation of the Hungry-Hunter Late Successional Reserve and Matrix lands would not be fulfilled if significant ground disturbances occurred in the soils supporting these stands. In view of this, we note that these areas are not compatible with tractor implementations of Harvest Thinning, Biomass Thinning, Seed-Tree cutting or Regeneration cutting, however TSI and controlled burning are compatible. We recommend that some or all of the above units with ground-breaking management plans be changed to eliminate ground-disturbing machinery.
Determination of LSR zones
To determine proposed harvest areas within LSR zones the unit boundaries were intersected with the Hunter Mountain LSR.
Units that overlap LSR areas are: 31, 66, 67, 70, 73, 88, 91, 98, 100, 113, 121, 124, 125, 129, 130, 135, 136, 151, 152, 153, 154, 155, 156, 158, 160, 161, 163, 166, 902.
The areas where the LSRs overlap unit boundaries are shown below along with old growth overlap.
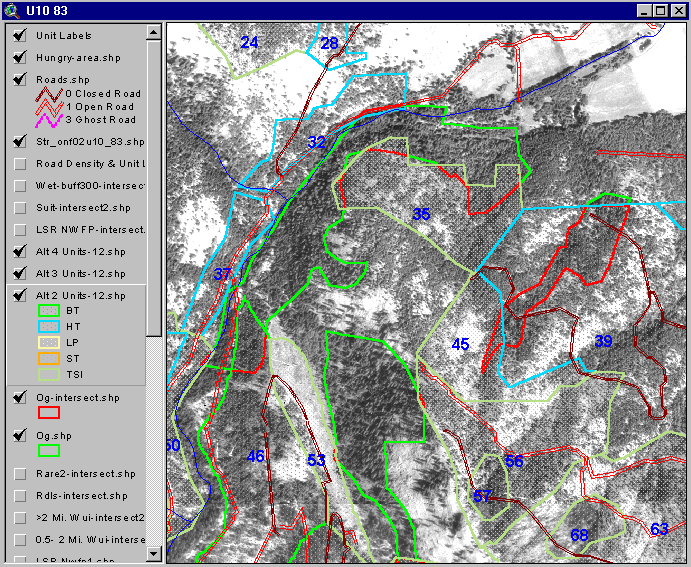
Determination of old growth and structured mature zones
To determine proposed harvest areas within stands containing old growth and mature trees, the unit boundaries were intersected with the delineation of old growth and structured mature forests digitized on screen using the digital orthophotos as a base image and using photo-interpretation of shadows and crown size to determine structure. In units that contained more than one polygon after the intersection, the areas of the separate polygons were added together and made into a single record before exporting to external files.
Units that overlap old growth areas are: 9, 19, 26, 32, 35, 39, 45, 46, 48, 49, 50, 53, 56, 58, 61, 65, 67, 69, 72, 73, 77, 78, 83, 93, 103, 107, 110, 111, 114, 118, 121, 130, 146, 149, 152, 153, 163, 904, 905, 910, 911, 917, 918.
The areas where unit boundaries
overlap LSRs (purple) or old growth (red) overlap are shown below.
Discussion
An example of stands identified
by photo-interpretation of mature forest is shown below in red (unit 73),
within two units planned for TSI under Alternative 3 or Alternative 2.
For conservation of mature forests (or potential future late-seral forests)
it is important that treatments not remove the older components of the
stand, or break up the corridors connecting these stands within the open
areas.
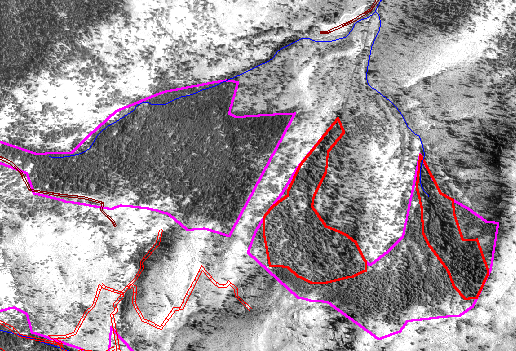
Another example of late-seral
/ mature forest structured forest (green or red) is shown below, along
with areas where unit boundaries (blue labels) overlap the older forests
in red. This is an area where TSI is planned.
The use of digital orthophoto interpretation to identify stands of old growth or mature-structured stands is useful for protecting areas within the Northwest Forest Plan. As long as treatments only involve TSI without the use of ground-disturbing machinery, this is an acceptable management option which we can support. There should be no significant overstory removal within the LSRs or mature stands, nor any activity that will fragment the forest connectivity.
Determination of suitable harvest areas
The EA defers harvest only within areas designated as suitable. To determine which proposed harvest units were located on suitable forest, the unit boundaries were intersected with the suitable areas layer from the Okanogan National Forest. In units which contained more than one polygon after the intersection, the areas of the separate polygons were added together and made into a single record before exporting to external files.
Units that overlap areas unsuitable for timber harvest are: 37, 39, 48, 53, 61, 69, 70, 72, 73, 74, 78, 83, 95, 101, 102, 112, 120, 126, 134, 148, 159, 904, 918.
The unit boundaries which overlap areas unsuitable for timber harvest are shown below in purple along with areas within 300 feet of NWI wetlands (red).
Determination of wetland buffers
To determine which proposed harvest units were within 300 feet of wetlands, the unit boundaries were intersected with a 300-foot buffer zone around all National Wetlands Inventory Wetlands.
Units which overlap areas within 300 feet of NWI wetlands are: 9, 77, 93, 118, 120, 146, 159, 901.
The unit boundaries which
overlap areas unsuitable for timber harvest (purple) or areas within 300
feet of NWI wetlands (red) are shown below.
Discussion
There should be no timber harvest using ground machinery in areas designated unsuitable for harvest. Any units listed above as unsuitable should be dropped from consideration for management involving machine-based ground disturbances.
Forested wetlands respond to soils more than to shade tolerance. This is their primary difference from upland forests. In addition, wetlands differ from riparian areas because their soils are low in nutrients. Specialized plants grow in wetlands due to their tolerance of anaerobic soil conditions. In the Hungry-Hunter area, wetlands are of limited extent.
Timber harvest within 300 feet of wetlands will have negative impacts on hydrology, grazing patterns, water quality, and development of late-seral forest structure. In view of these strong constraints, no timber harvest should occur in the units above listed within 300 feet of wetlands. TSI is not recommended in these areas either, however wetland restoration, beaver re-introduction, and animal movement management can be supported.
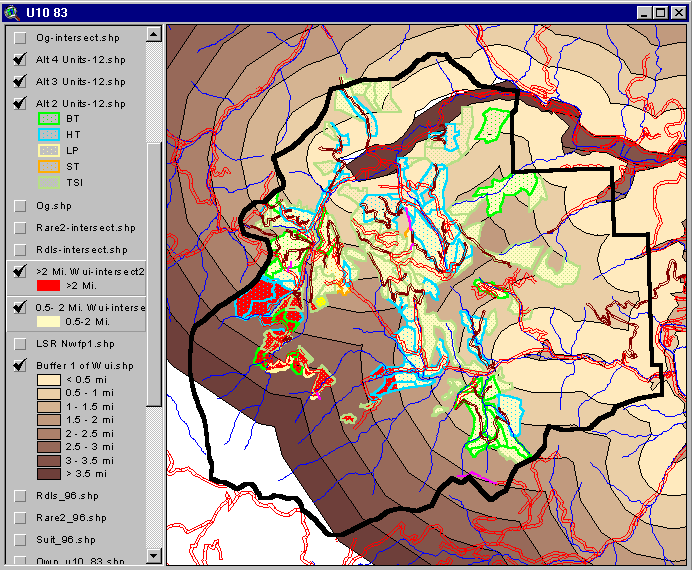
Determination of WUI zones
To determine proposed harvest areas within WUI zones the unit boundaries were intersected with a buffer zone around all structures, in intervals of 0.5 mile. A large number of treatment units were split across the WUI distance boundaries. When exported to an external file, only the shortest distances to WUI zones were included in the spreadsheet.
Units which are further completely lying beyond 2 miles from the WUI zone are: 81, 92, 99, 103, 105, 107, 109, 111, 112, 114, 115, 116, 117, 126, 128, 134, 149, 164, 906, 907, 910, 911, 916, 917.
Units which are between 1.5 to 2 miles and possibly overlapping beyond 2 miles from the WUI zone are: 75, 76, 80, 82, 85, 86, 87, 88, 89, 90, 93, 95, 101, 102, 119, 120, 146, 148, 158, 905, 912, 913, 914, 915, 918, 919.
The illustration below
shows unit boundaries which are beyond 2 miles of the WUI zone in red and
units which are from 0.5 to 2 miles in yellow.
Discussion
The use of crown fire potential risk beyond a half mile from houses and structures is not well accepted scientifically. Several legal definitions use distances of up to 2 miles for designation of a WUI zone. The purpose and need should be changed so that it does not advocate benefits to human communities and structures from treatments lying beyond 0.5 miles of a WUI zone. Treatments beyond 0.5 mile of structures may be acceptable if they are intended to accomplish ecosystem management.
Management should include a discussion of the trade-offs from fuels management. A thorough discussion was given in the A to A EA by Chelan Ranger District. Thinning has been shown to be ineffective at reducing the severity unless it is accompanied by removal of fuel (van Wagtendonk, 1996). The A to A project noted that even if fuels are effectively removed, the rate of fire spreading will be up to 10 times higher following thinning due to increased rates of drying and wind speeds in open stands. Treatments proposed in the Hungry Hunter project that do not plan for regular removal of fine fuels have a possibility of increasing the risk of fire to nearby communities. This should be frankly discussed with those living in the area. In the event of a fast-moving surface fire that travels from a thinned unit to houses, the Forest Service could be found liable.
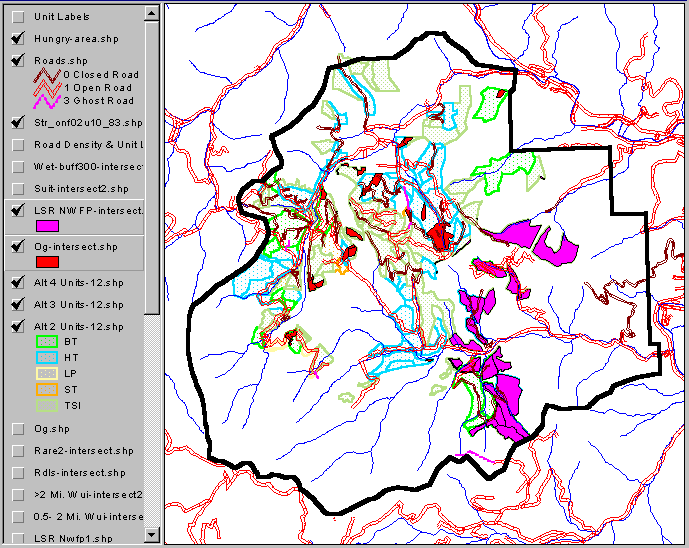
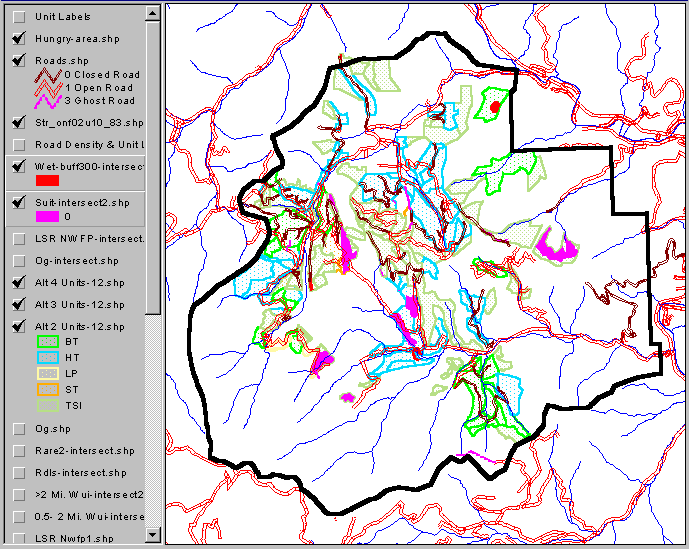
Forest fragmentation
To examine fragmentation,
the layers containing all treatment units under all alternatives was overlaid
onto a digital orthophoto and zoomed out to give a landscape perspective.
The location of forested corridors that could be fragmented by at least
one alternative under the Hungry-Hunter proposal is shown below.

All of the proposed management activities, including controlled burning have the potential to fragment forested corridors. Corridors were identified by the Methow Ranger District Assessment of the Northeastern Cascades Late-Successional Reserves (1988). Units which are likely to fragment intact forested corridors are the following: 31, 34, 36, 62, 75, 76, 82, 85, 130, 136, 155, 160, 164, 912.
Discussion
To be consistent with the Northwest Plan, units that will fragment forest connectivity should be mitigated in the EA. In view of the significant other disturbances occurring in this area at this time, it is recommended that all harvest treatments including TSI in these key connectivity corridors be put off for one decade to provide for late-seral wildlife protection in the interim recovery period for the area.
Cumulative impacts
Cumulative impacts were assessed by considering all of the impacts determined from the above analysis in a single spreadsheet. This spreadsheet is printed as a table below. A decision-key for scoring the units is presented first.
The decision key below can be used to determine which units need modification. Units that may need modification are scored based on the highest impact. The procedure for determining whether a unit needs modification is as follows:
Key to decisions
(Note: units 57 and 60
use helicopters, and are not included as ground-based mechanical harvest).
WUI distance is not analyzed in this key.)
| Impact | Precluded harvest | Cautionary harvest |
| RARE II | >0.2 ac (total of all impacts) of ground-based mechanical (BT, LP, HT, ST) | |
| Roadless | >0.2 ac (total of all impacts) of ground-based mechanical (BT, LP, HT, ST) | |
| LSR | >0.2 ac (total of all impacts) of overstory>7" removal (HT, ST) | >0.2 ac (total of all impacts) of ground-based mechanical (BT, LP) |
| Old growth /mature | >0.2 ac (total of all impacts) of overstory>7" removal (HT, ST) | >0.2 ac (total of all impacts) of ground-based mechanical (BT, LP) |
| Unsuitable | ground-based mechanical (BT, LP, HT, ST) TSI, helicopter units | |
| Wetland | all harvests (BT, LP, HT, ST, TSI) | |
| Road Density | score of "1" for ground-based mechanical (BT, LP, HT, ST) | |
| Fragmentation | score of "1" for forest thinning or logging (BT, LP, HT, ST, TSI) |
Table of Unit Impacts
Key: BT = Biomass Thin;
LP = Patch Lodgepole Regeneration Harvest; HT = Harvest Thinning; ST =
Seed Tree Regeneration Harvest; TSI = Timber Stand Improvement; Rare II
= acreage overlapping Rare II roadless areas; Roadless = acreage overlapping
roadless areas; LSR = acreage overlapping Hungry Hunter LSR; Old Growth
= acreage overlapping old growth or mature-structured stands; Unsuit =
acreage overlapping areas unsuitable for harvest; Wetland = acreage overlapping
300-foot wetland buffers; WUI-DX = mileage from closest part of the unit
to WUI zone; Road Dens = 1 for significant closed road density not addressed
in the EA; Frag = 1 for units which fragment the existing forest.
Click
here to view a COLOR pdf file of table (81K)
Click
here to view the COLOR table as an excel spreadsheet
| Unit Id | Acres | Alt2 | Alt3 | Alt4 | Rare II | Road-less | LSR | Old Growth | Unsuit | Wet-land | WUI-DX | Rd Dens | Frag |
| 2 | 6.769 | TSI | TSI | TSI | 6.769 | 1 | 0 | 0 | |||||
| 3 | 33.664 | TSI | 33.414 | 0.5 | 0 | 0 | |||||||
| 4 | 80.272 | TSI | 77.793 | 0.5 | 0 | 0 | |||||||
| 5 | 25.911 | TSI | TSI | TSI | 25.911 | 1 | 0 | 0 | |||||
| 6 | 82.803 | HT | HT | HT | 39.93 | 0.5 | 0 | 0 | |||||
| 8 | 52.156 | TSI | 48.984 | 0.5 | 0 | 0 | |||||||
| 9 | 94.843 | BT | 49.783 | 6.523 | 14.023 | 0.5 | 0 | 0 | |||||
| 10 | 9.099 | HT | HT | HT | 0.5 | 0 | 0 | ||||||
| 11 | 81.083 | TSI | 72.58 | 0.5 | 0 | 0 | |||||||
| 12 | 22.578 | HT | HT | HT | 0.898 | 0.5 | 0 | 0 | |||||
| 13 | 40.425 | HT | HT | HT | 33.21 | 0.5 | 0 | 0 | |||||
| 15 | 11.428 | TSI | 4.448 | 0.5 | 0 | 0 | |||||||
| 17 | 18.32 | TSI | TSI | TSI | 0.25 | 0.5 | 0 | 0 | |||||
| 18 | 5.281 | HT | HT | HT | 0.5 | 0 | 0 | ||||||
| 19 | 12.858 | HT | HT | HT | 9.867 | 4.463 | 0.5 | 0 | 0 | ||||
| 22 | 77.793 | TSI | TSI | TSI | 74.035 | 0.5 | 0 | 0 | |||||
| 24 | 27.539 | TSI | 18.979 | 0.5 | 0 | 0 | |||||||
| 26 | 11.468 | TSI | TSI | 11.468 | 4.974 | 0.5 | 0 | 0 | |||||
| 27 | 61.549 | HT | HT | HT | 27.622 | 0.5 | 0 | 0 | |||||
| 28 | 7.193 | HT | HT | HT | 0.5 | 0 | 0 | ||||||
| 29 | 86.436 | HT | HT | HT | 37.773 | 1 | 0 | 0 | |||||
| 30 | 60.344 | HT | HT | HT | 5.852 | 0.5 | 0 | 0 | |||||
| 31 | 47.31 | TSI | 47.31 | 0.359 | 1 | 0 | 1 | ||||||
| 32 | 21.25 | HT | HT | HT | 0.658 | 0.5 | 0 | 0 | |||||
| 33 | 18.773 | HT | HT | HT | 1 | 0 | 0 | ||||||
| 34 | 173.894 | BT | BT | BT | 169.336 | 1 | 0 | 1 | |||||
| 35 | 46.51 | TSI | 8.522 | 0.5 | 0 | 0 | |||||||
| 36 | 25.548 | BT | BT | BT | 1.5 | 1 | 1 | ||||||
| 37 | 15.69 | HT | HT | HT | 0.736 | 0.5 | 0 | 0 | |||||
| 39 | 152.771 | HT | HT | HT | 18.755 | 1.811 | 0.5 | 1 | 0 | ||||
| 40 | 61.633 | TSI | TSI | TSI | 61.496 | 1 | 0 | 0 | |||||
| 41 | 20.899 | TSI | 7.877 | 1 | 0 | 0 | |||||||
| 42 | 70.37 | HT | HT | HT | 2.614 | 1 | 1 | 0 | |||||
| 43 | 51.444 | TSI | TSI | TSI | 1.5 | 1 | 0 | ||||||
| 44 | 11.419 | TSI | TSI | TSI | 1.5 | 1 | 0 | ||||||
| 45 | 32.668 | TSI | 1.46 | 0.5 | 0 | 0 | |||||||
| 46 | 71.595 | BT | BT | BT | 6.033 | 1 | 1 | 0 | |||||
| 48 | 147.276 | HT | HT | HT | 49.82 | 0.112 | 1 | 1 | 0 | ||||
| 49 | 95.017 | HT | HT | HT | 2.638 | 0.075 | 1 | 1 | 0 | ||||
| 50 | 18.729 | TSI | TSI | TSI | 0.137 | 1 | 0 | 0 | |||||
| 51 | 28.327 | TSI | TSI | TSI | 7.805 | 1 | 0 | 0 | |||||
| 53 | 23.584 | TSI | TSI | TSI | 0.069 | 9.94 | 1 | 1 | 0 | ||||
| 56 | 60.285 | TSI | TSI | TSI | 0.122 | 1 | 1 | 0 | |||||
| 57 | 7.002 | ST | ST | 1 | 1 | 0 | |||||||
| 58 | 43.858 | TSI | TSI | TSI | 8.916 | 0.07 | 1.5 | 0 | 0 | ||||
| 60 | 15.606 | ST | ST | 1.5 | 1 | 0 | |||||||
| 61 | 39.045 | ST | ST | 4.998 | 0.532 | 1 | 0 | 0 | |||||
| 62 | 150.442 | BT | BT | BT | 1.5 | 1 | 1 | ||||||
| 63 | 79.086 | TSI | TSI | TSI | 1 | 1 | 0 | ||||||
| 64 | 41.488 | TSI | TSI | TSI | 1 | 0 | 0 | ||||||
| 65 | 66.443 | HT | HT | HT | 18.103 | 1.5 | 1 | 0 | |||||
| 66 | 15.081 | TSI | TSI | 0.134 | 15.081 | 0.5 | 0 | 0 | |||||
| 67 | 122.904 | TSI | TSI | TSI | 1.658 | 0.124 | 1 | 1 | 0 | ||||
| 68 | 10.83 | ST | ST | 1 | 1 | 0 | |||||||
| 69 | 83.512 | ST | ST | 0.136 | 4.082 | 1.5 | 1 | 0 | |||||
| 70 | 121.261 | TSI | TSI | 103.632 | 121.261 | 7.891 | 1.5 | 0 | 0 | ||||
| 71 | 16.916 | TSI | TSI | TSI | 1.5 | 0 | 0 | ||||||
| 72 | 16.564 | TSI | TSI | 2.347 | 12.063 | 1.5 | 0 | 0 | |||||
| 73 | 116.463 | TSI | TSI | 116.463 | 116.463 | 57.06 | 83.373 | 1 | 0 | 0 | |||
| 74 | 165.717 | TSI | TSI | TSI | 1.109 | 1.5 | 1 | 0 | |||||
| 75 | 26.416 | BT | BT | BT | 22.557 | 2 | 0 | 1 | |||||
| 76 | 49.16 | HT | HT | HT | 16.394 | 2 | 0 | 1 | |||||
| 77 | 57.497 | TSI | TSI | TSI | 25.172 | 2.912 | 2.566 | 1.5 | 1 | 0 | |||
| 78 | 13.51 | TSI | TSI | 8.747 | 9.521 | 1.5 | 0 | 0 | |||||
| 80 | 23.606 | ST | ST | TSI | 17.437 | 2 | 0 | 0 | |||||
| 81 | 16.42 | HT | HT | HT | 4.682 | 2.5 | 0 | 0 | |||||
| 82 | 19.791 | TSI | 10.301 | 2 | 0 | 1 | |||||||
| 83 | 17.029 | HT | HT | HT | 7.794 | 17.029 | 1.5 | 0 | 0 | ||||
| 84 | 24.713 | HT | HT | HT | 1.5 | 0 | 0 | ||||||
| 85 | 80.842 | HT | HT | HT | 45.756 | 2 | 0 | 1 | |||||
| 86 | 10.97 | TSI | TSI | TSI | 2 | 0 | 0 | ||||||
| 87 | 34.487 | HT | HT | HT | 2 | 1 | 0 | ||||||
| 88 | 29.663 | HT | HT | HT | 0.137 | 2 | 0 | 0 | |||||
| 89 | 24.311 | TSI | TSI | TSI | 7.147 | 2 | 1 | 0 | |||||
| 90 | 21.456 | TSI | TSI | TSI | 17.24 | 2 | 0 | 0 | |||||
| 91 | 44.814 | BT | BT | 44.814 | 1 | 0 | 0 | ||||||
| 92 | 17.721 | BT | BT | BT | 9.433 | 2.5 | 0 | 0 | |||||
| 93 | 18.481 | TSI | 17.775 | 6.045 | 0 | 2 | 0 | 0 | |||||
| 94 | 172.105 | TSI | TSI | TSI | 1.5 | 0 | 0 | ||||||
| 95 | 29.587 | HT | HT | HT | 5.146 | 2 | 0 | 0 | |||||
| 98 | 28.434 | TSI | 28.434 | 1 | 0 | 0 | |||||||
| 99 | 11.628 | HT | HT | HT | 2.821 | 3 | 0 | 0 | |||||
| 100 | 42.094 | HT | HT | 42.094 | 1 | 0 | 0 | ||||||
| 101 | 47.143 | HT | HT | HT | 19.214 | 2 | 0 | 0 | |||||
| 102 | 63.314 | HT | HT | HT | 0.048 | 27.58 | 2 | 0 | 0 | ||||
| 103 | 42.177 | TSI | TSI | TSI | 12.507 | 0.006 | 3 | 1 | 0 | ||||
| 105 | 7.568 | TSI | TSI | TSI | 7.449 | 3.277 | 3 | 0 | 0 | ||||
| 107 | 8.133 | BT | BT | BT | 8.133 | 0.498 | 6.455 | 3 | 0 | 0 | |||
| 109 | 24.126 | BT | BT | BT | 10.019 | 3 | 0 | 0 | |||||
| 110 | 49.913 | HT | HT | HT | 2.602 | 0.052 | 1.5 | 0 | 0 | ||||
| 111 | 16.579 | TSI | TSI | TSI | 16.579 | 1.249 | 0.166 | 3 | 0 | 0 | |||
| 112 | 45.913 | TSI | TSI | TSI | 45.913 | 20.732 | 38.049 | 3 | 0 | 0 | |||
| 113 | 26.42 | HT | HT | 26.42 | 1 | 0 | 0 | ||||||
| 114 | 16.191 | LP | LP | 14.26 | 4.253 | 0.01 | 3.5 | 0 | 0 | ||||
| 115 | 6.32 | HT | HT | HT | 6.32 | 2.5 | 0 | 0 | |||||
| 116 | 14.218 | HT | HT | HT | 0.521 | 2.5 | 0 | 0 | |||||
| 117 | 10.478 | LP | LP | 10.478 | 4.046 | 3 | 0 | 0 | |||||
| 118 | 68.782 | HT | HT | HT | 62.728 | 1.166 | 4.774 | 1.5 | 0 | 0 | |||
| 119 | 27.259 | HT | HT | HT | 27.259 | 2 | 0 | 0 | |||||
| 120 | 22.195 | HT | HT | HT | 1.111 | 1.722 | 0.116 | 2 | 0 | 0 | |||
| 121 | 36.544 | BT | BT | 36.544 | 36.544 | 0.402 | 1 | 0 | 0 | ||||
| 124 | 10.336 | TSI | TSI | 10.252 | 10.336 | 1.5 | 0 | 0 | |||||
| 125 | 108.618 | BT | BT | BT | 50.359 | 2.522 | 1 | 0 | 0 | ||||
| 126 | 3.577 | LP | LP | 3.577 | 2.021 | 0.91 | 3.5 | 0 | 0 | ||||
| 127 | 3.219 | TSI | TSI | TSI | 3.219 | 1.5 | 0 | 0 | |||||
| 128 | 11.651 | TSI | TSI | TSI | 11.651 | 2.5 | 0 | 0 | |||||
| 129 | 45.848 | BT | BT | BT | 21.934 | 4.088 | 1 | 0 | 0 | ||||
| 130 | 69.61 | BT | BT | 56.781 | 68.991 | 0.011 | 1 | 0 | 1 | ||||
| 131 | 11.098 | TSI | TSI | TSI | 11.098 | 1.5 | 0 | 0 | |||||
| 134 | 12.472 | TSI | 0.887 | 12.472 | 11.7 | 3 | 0 | 0 | |||||
| 135 | 29.396 | BT | BT | BT | 19.524 | 1.24 | 1.5 | 0 | 0 | ||||
| 136 | 40.167 | TSI | 40.167 | 40.167 | 1.5 | 0 | 1 | ||||||
| 146 | 9.763 | TSI | 8.228 | 9.055 | 5.837 | 2 | 0 | 0 | |||||
| 148 | 14.172 | HT | HT | HT | 0.263 | 2 | 0 | 0 | |||||
| 149 | 11.52 | TSI | TSI | TSI | 0.027 | 3 | 0 | 0 | |||||
| 150 | 3.806 | TSI | TSI | TSI | 3.806 | 1.5 | 0 | 0 | |||||
| 151 | 33.948 | TSI | TSI | 33.506 | 1 | 0 | 0 | ||||||
| 152 | 16.375 | BT | BT | 1.308 | 16.276 | 1.471 | 1 | 0 | 0 | ||||
| 153 | 12.288 | BT | BT | 8.956 | 12.288 | 0.193 | 1 | 0 | 0 | ||||
| 154 | 5.446 | TSI | TSI | TSI | 4.971 | 2.172 | 1.5 | 0 | 0 | ||||
| 155 | 23.151 | BT | BT | 15.807 | 23.043 | 1.5 | 0 | 1 | |||||
| 156 | 12.742 | BT | BT | 12.416 | 11.164 | 1.5 | 0 | 0 | |||||
| 157 | 21.642 | HT | HT | HT | 0.5 | 0 | 0 | ||||||
| 158 | 22.078 | TSI | TSI | TSI | 2.862 | 2 | 0 | 0 | |||||
| 159 | 49.813 | HT | HT | HT | 15.624 | 12.888 | 5.542 | 1.5 | 0 | 0 | |||
| 160 | 11.084 | BT | BT | 5.583 | 10.912 | 1.5 | 0 | 1 | |||||
| 161 | 19.17 | HT | HT | 19.17 | 1 | 0 | 0 | ||||||
| 162 | 16.61 | TSI | TSI | TSI | 12.757 | 0.5 | 0 | 0 | |||||
| 163 | 29.879 | TSI | 29.879 | 29.879 | 12.41 | 0.5 | 0 | 0 | |||||
| 164 | 117.483 | HT | HT | HT | 117.483 | 2.5 | 0 | 0 | |||||
| 165 | 31.823 | HT | HT | HT | 1.5 | 1 | 0 | ||||||
| 166 | 102.348 | HT | HT | 84.46 | 102.348 | 1 | 0 | 0 | |||||
| 167 | 11.518 | TSI | HT | TSI | 1.5 | 1 | 0 | ||||||
| 901 | 14.293 | TSI | 14.293 | 2.312 | 1 | 0 | 0 | ||||||
| 902 | 29.812 | TSI | 7.448 | 29.812 | 0.5 | 0 | 0 | ||||||
| 903 | 39.45 | TSI | 6.543 | 1.5 | 1 | 0 | |||||||
| 904 | 23.03 | TSI | 12.879 | 0.747 | 1.5 | 0 | 0 | ||||||
| 905 | 4.248 | TSI | 0.004 | 2 | 0 | 0 | |||||||
| 906 | 6.663 | TSI | HT | TSI | 6.359 | 2.5 | 0 | 0 | |||||
| 907 | 12.54 | BT | HT | BT | 6.101 | 2.5 | 0 | 0 | |||||
| 910 | 3.725 | LP | LP | LP | 3.725 | 1.335 | 1.777 | 3 | 0 | 0 | |||
| 911 | 19.759 | BT | 19.759 | 16.629 | 1.01 | 3 | 0 | 0 | |||||
| 912 | 9.717 | TSI | HT | 9.717 | 2 | 0 | 1 | ||||||
| 913 | 5.729 | TSI | 2 | 0 | 0 | ||||||||
| 914 | 2.76 | TSI | 2.76 | 2 | 0 | 0 | |||||||
| 915 | 2.187 | TSI | TSI | 2 | 0 | 0 | |||||||
| 916 | 26.839 | HT | 25.827 | 2.5 | 0 | 0 | |||||||
| 917 | 5.916 | LP | 5.916 | 3.842 | 0.264 | 3 | 0 | 0 | |||||
| 918 | 14.036 | ST | 8.115 | 0.022 | 8.231 | 2 | 0 | 0 | |||||
| 919 | 6.44 | TSI | ST | 5.09 | 2 | 0 | 0 | ||||||
| 920 | 6.643 | HT | 1.5 | 0 | 0 |
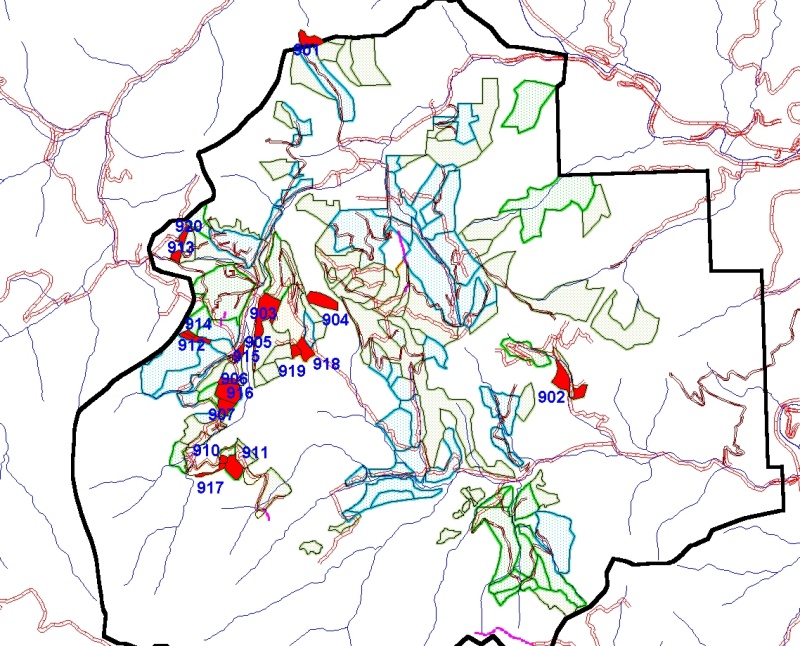
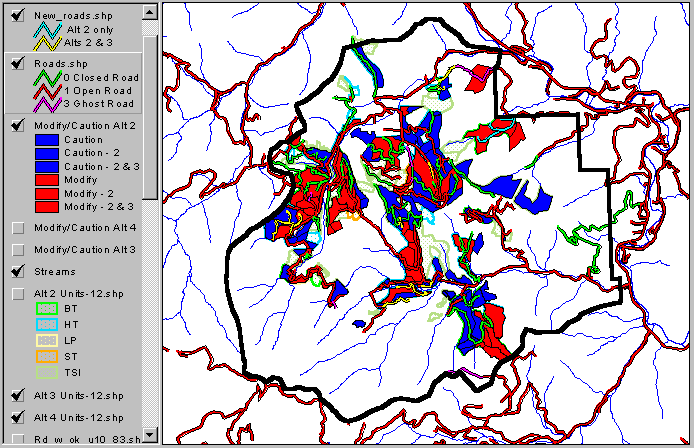
Conclusion
Our analysis identified 45 treatment units that appear to require modification of size or treatment, or possibly deletion from the project. These stands are: 19, 31, 32, 34, 36, 37, 39, 46, 48, 61, 62, 65, 69, 75, 76, 77, 82, 83, 85, 93, 95, 100, 101, 102, 107, 113, 114, 117, 118, 126, 130, 136, 146, 148, 151, 155, 159, 160, 161, 166, 901, 910, 911, 912, 917, 918. The analysis also identified numerous other treatment units that need a review and possibly mitigation as well.
The Alternative 2 treatment
units recommended for modification/deletion (red)
or caution (blue) are shown in the
following map.
The Alternative 3 treatment
units recommended for modification/deletion (red)
or caution (blue) are shown in the
following map.

The Alternative 4 treatment
units recommended for modification/deletion (>red)
or caution (blue) are shown in the
following map.

These analyses were made possible by the advent of relatively powerful desktop computing environments and software such as Arcview Spatial Analyst as well as many data layers available online at GIS repositories. In addition to identifying potential treatment impacts, the use of a GIS to do this analysis allowed results to be visualized easily and be shared by all interested in land management planning. These analyses can be readily extended to include temporal scales, as in the decision to temporarily defer all harvest in forests that would be fragmented by the harvest units. The tables and shapefiles used in this analysis are available for download at this website.
References
- Methow Ranger District. 1998. An Assessment of the Northeastern Cascades Late-Successional Reserves.
- van Wagtendonk, J.W. 1996. Use of a deterministic fire growth model to test fuel treatments. in Status of the Sierra Nevada: Sierra Nevada Ecosystem Project Final Report to Congress Volume II. Wildland Resources Center Report No. 37. Center for Water and Wildland Resources. University of California, Davis.